Sonic Analysis Visualization
Areas Assisted:
- Hard of Hearing
Possible Applications:
- Theory/Analysis/Pedagogy
Potentially useful for the surface level experience of music, there are established programs and systems to visualize music in terms of Frequency, Amplitude, and other elements through microphone input. While this may not convey the in-depth information of a score, this technology can be an easy and often portable way to offer a visualization of “surface level” sonic events in music both in a recorded setting and in live performance. Many applications and website-based spectrum analyzers are available on mobile devices as well as desktop computers, providing options for students studying at home or attending live performances.
When provided to supplement a score, this can be a great way for students to better visualize the musical events. However, without a score, this can also prove useful for beginning music students or students taking general education music courses to familiarize themselves with the density and events within the act of listening to music.
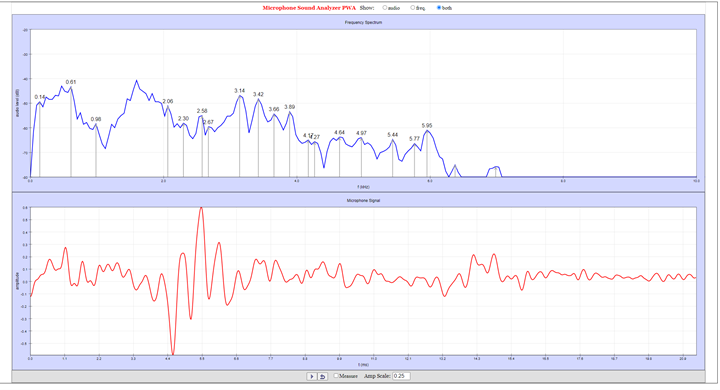
Audio Spectrum Analyzer
Microphone Sound Analyzer is a free online sound spectrum analyzer that uses your device’s microphone to provide a visual spectrum analysis with regards to frequency and amplitude. Since this analysis is performed in real time, the contours for frequency and amplitude move rhythmically in relation to the musical events as they occur. This allows for a relative facsimile of experiencing the sonic events in real time, with representations of density, pitch, and dynamic.
The application can be run from a desktop computer with a microphone to pic up audio played by the same computer or another device.
Considerations for Sonic Analysis Visualization
- The core strength of this option is that it easily creates a visual representation/facsimile of the listening experience with minimal prep time required.
- That said, without any additional visual material (such as the score), this method is not a very precise one in terms of visually conveying pitch, harmonies, rhythms, and the like. For a visual representation that has greater accuracy, consider reviewing the option for MIDI Playback Visualization using MIDITrail.
- For general education music courses and beginning courses, this may be a great option since it isn’t heavily reliant on a music theory background to convey important information. It’s also a useful option for records that may not have a score readily available.